Volumes & Sessions
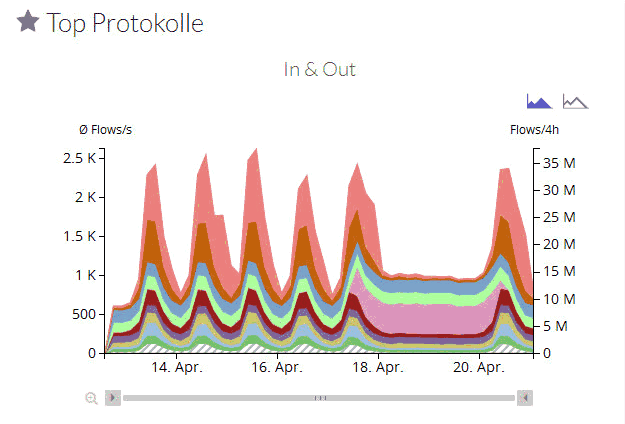
The following two examples have been extracted from the same netflow information. The first picture shows the consumed bandwidth per protocol. In the second, the number of flows per protocol is displayed.
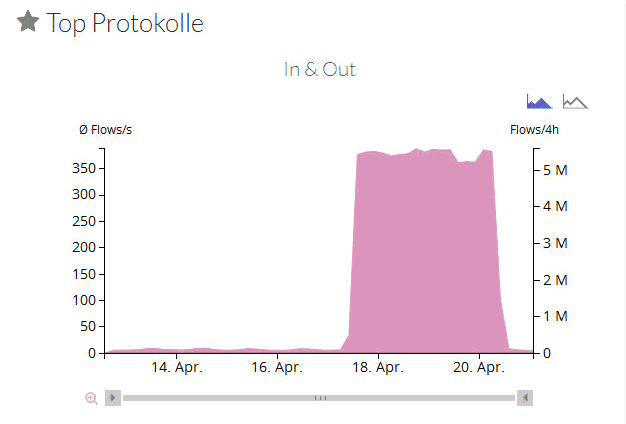
The result is typical for an office location. Bandwidth consumption is going up and down during a regular work day (and usual protocols in the top).
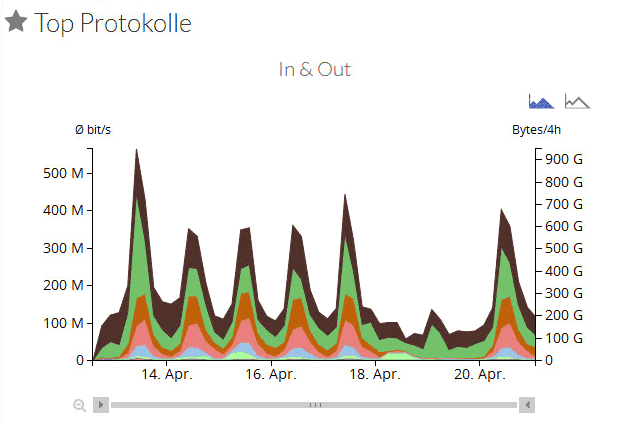
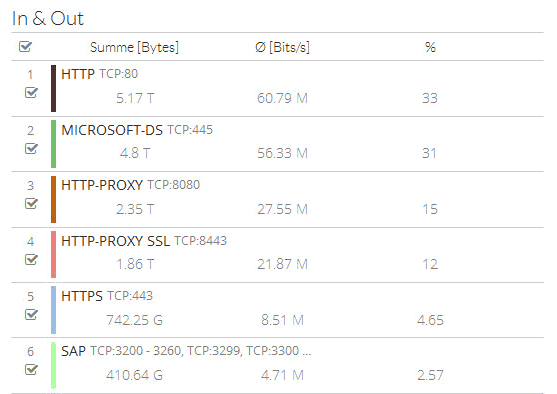
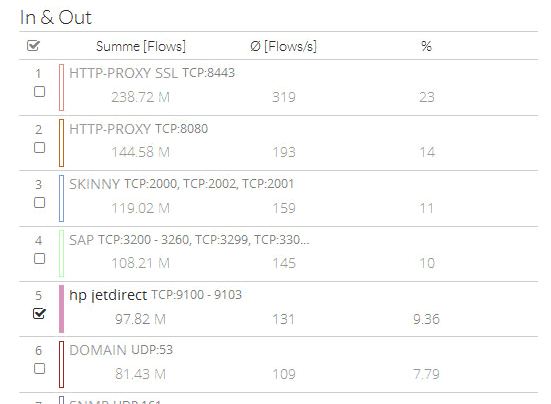
The protocols generating the most traffic are different from the protocols originating a high number of sessions:
- there is a new protocol with a lot of sessions at the weekend (that protocol "hp jetdirect" in this example attracted attention never before)
- this protocol is not even visible in the byte sum, but generate ~10% of all sessions
- the configuration has been changed on Monday, so its dropping down again
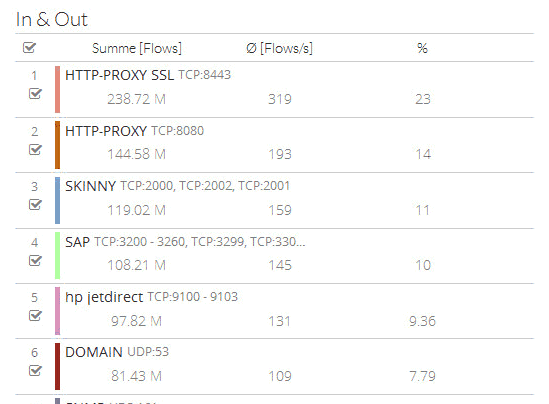
Thanks to the interactivity this protocol can be highlighted directly in the analysis result (without starting another analysis), so that is very much clear that here a temporary misconfiguration has been submitted.
IsarFlow's Drill Down functionality provides information to identify the session-intensive traffic by listing the top hosts and the related communication counterparts (top sessions).